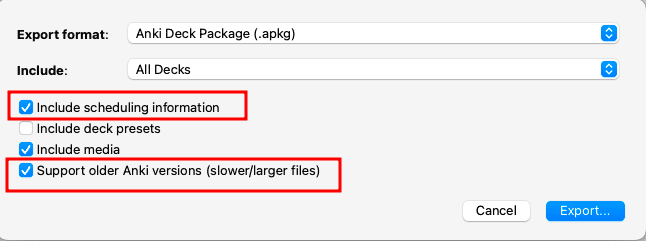
Anki stores a record for each review. This powers the built-in stats page, which is quite limited. Luckily, it’s easy to get the data:
- File -> Export
- Choose Anki Deck Package, Include Scheduling Information and Support older Anki versions

- Unzip the resulting file
-
Extract the review log into a CSV:
sqlite3 collection.anki21 -header -csv "SELECT * FROM revlog;" > output.csv - Load the CSV into pandas
-
Add date, datetime and week columns:
df['datetime'] = pd.to_datetime(df['id'], unit='ms') df['date'] = df['datetime'].dt.date -
Now you can do things like see the median number of cards per session, seconds per card etc. for a particular period:
(df.groupby('date')['time']
.agg(['sum', 'count'])
.assign(minutes=lambda x: round(x['sum'] / 1000 / 60, 0).astype(int))
.assign(seconds_per_card=lambda x: round(x['sum'] / x['count'] / 1000,0).astype(int))
.tail(21)
).median()
Aggregation
(df.groupby('date')['time']
.agg(['sum', 'count'])
.assign(minutes=lambda x: x['sum'] / 1000 / 60)
.assign(seconds_per_card=lambda x: x['sum'] / x['count'] / 1000)
.tail(21)
)
Custom percentiles (instead of histogram)
custom_percentiles = [0.01, 0.05, 0.1, 0.25, 0.5, 0.75, 0.9, 0.95, 0.99]
df['values'].describe(percentiles=custom_percentiles)